ZODOC — Zodiacal Oscillations
An experimental research project examining recurring astronomical timing patterns and their relationship to terrestrial weather.
Astronomical Timing
Planetary cycles, aspects and recurring celestial configurations are examined as potential timing signals.
Weather Patterns
Timing signals are compared with tropical cyclones, severe weather and seasonal pattern changes.
Verification & Research
Forecasts and timing signals are tested against observed weather, with results documented for continued evaluation.
SEPTEMBER 2026
ORIGINAL POST AUGUST 21, 2026 ON "X"
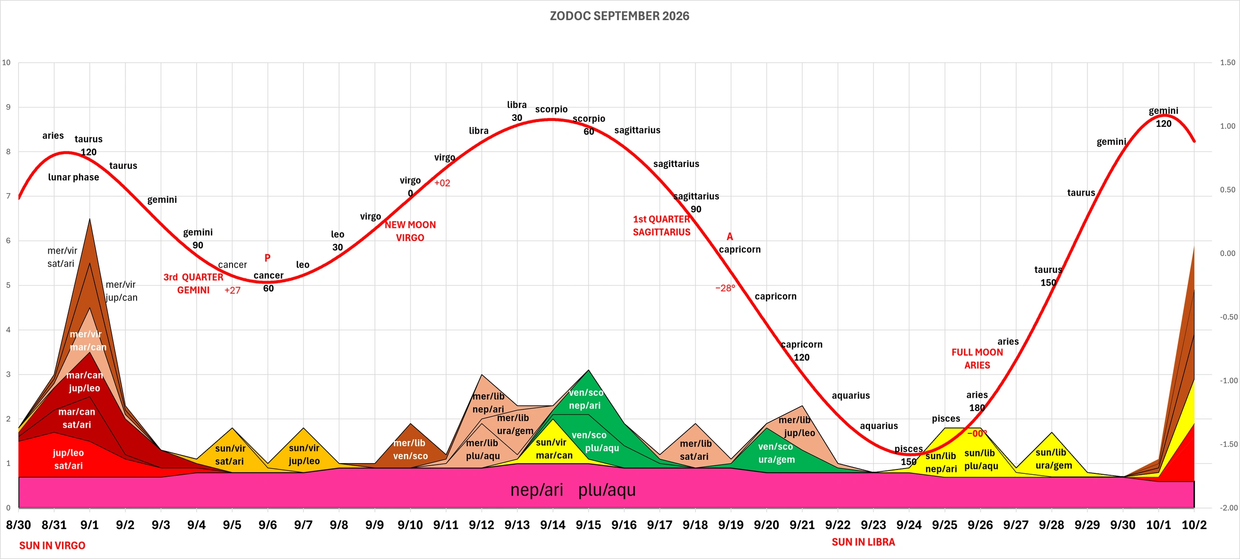
This graphic is a time series distribution of planet and sign combinations for a single lunar cycle in the month of September 2026. Please note that the emphasis is on the planet/sign combinations rather than the geometric angles, which have a separate consideration.
This is my basic forecasting tool for a variety of mundane applications which can be found in greater detail on the various pages of AstroWeather.com
OCTOBER 2026
ORIGINAL POST AUGUST 21, 2026 ON "X"
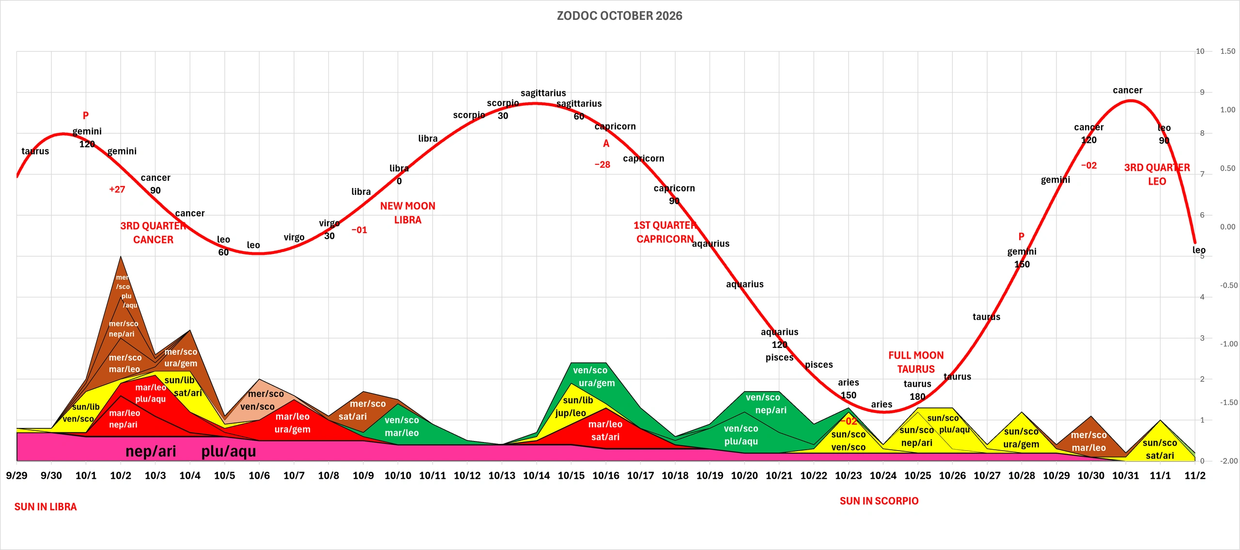
This graphic is a time series distribution of planet and sign combinations for a single lunar cycle in the month of October 2026. Please note that the emphasis is on the planet/sign combinations rather than the geometric angles, which have a separate consideration.
This is my basic forecasting tool for a variety of mundane applications which can be found in greater detail on the various pages of AstroWeather.com
NOVEMBER 2026
ORIGINAL POST 9/17/2026 ON ASTROWEATHER.com
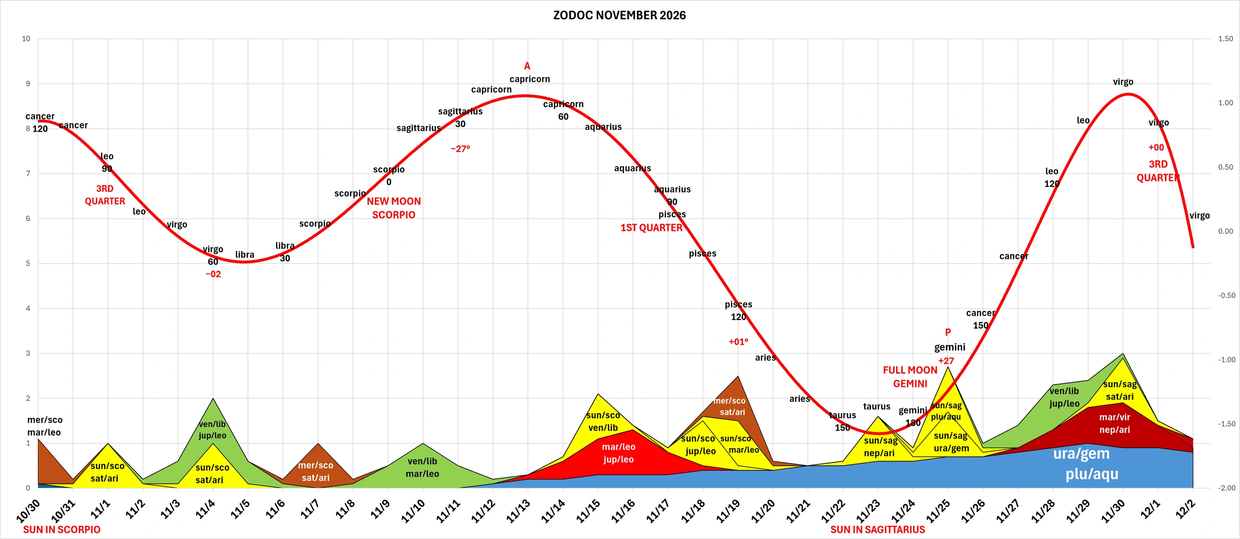
This graphic is a time series distribution of planet and sign combinations for a single lunar cycle in the month of November 2026. Please note that the emphasis is on the planet/sign combinations rather than the geometric angles, which have a separate consideration.
This is my basic forecasting tool for a variety of mundane applications which can be found in greater detail on the various pages of AstroWeather.com
DECEMBER 2026
ORIGINAL POST 9/17/2026 ON ASTROWEATHER.com
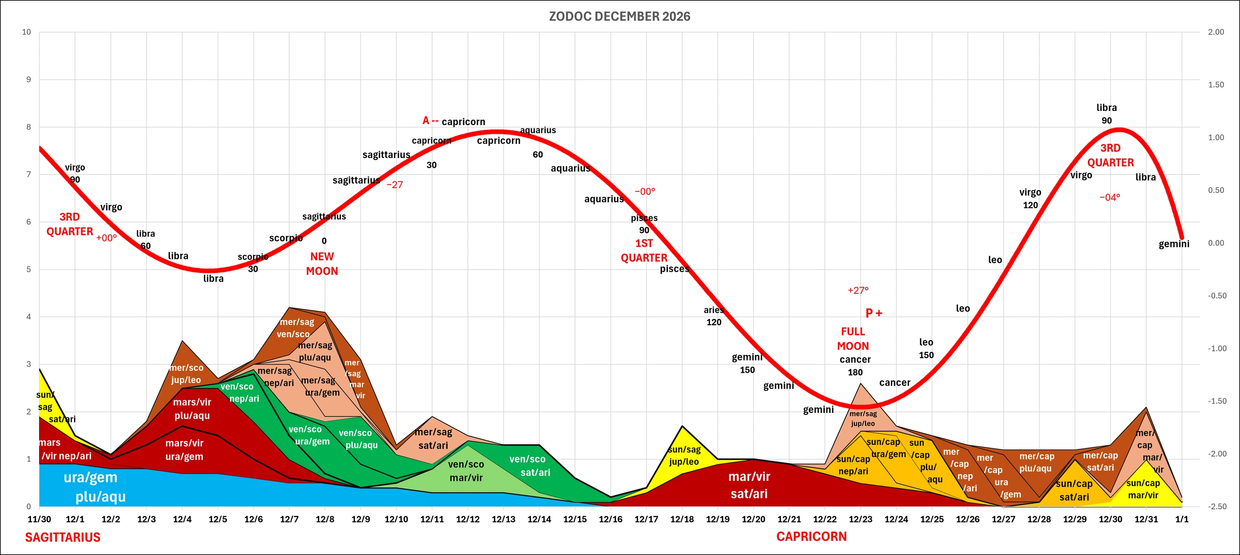
This graphic is a time series distribution of planet and sign combinations for a single lunar cycle in the month of December 2026. Please note that the emphasis is on the planet/sign combinations rather than the geometric angles, which have a separate consideration.
This is my basic forecasting tool for a variety of mundane applications which can be found in greater detail on the various pages of AstroWeather.com